Latest figures from the Transport Technology Forum (TTF) suggest average traffic levels across England are close to pre-lockdown levels, with daytime traffic levels exceeding the pre-lockdown level for the first time.
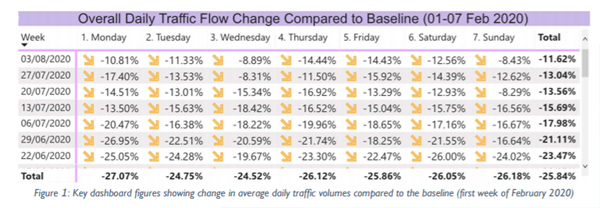
The TTF's latest report shows that the week commencing 3 August saw daily traffic volumes that were on average just 11.62% below the baseline figure from the first week of February this year.
This is compared to figures from mid-June, week commencing 15/06/2020, which were 26.69% lower.
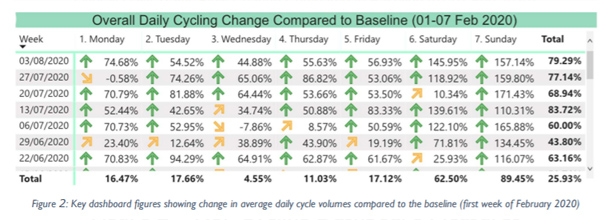
Cycling figures continue to show a steady increase and are now up to 79.29% higher than the February baseline figure.
The figures show a gradual but steady increase week on week. Afternoon peaks are now roughly back in line with February's baseline but morning peak traffic, while increasing, is still lower than it was before restrictions were introduced.
Traffic Flow
- Traffic for the week commencing 3 August saw an increase in flows (1.4 percentage points) compared to the previous week, bringing the overall traffic count average for the week to a reduction of 11.6% compared to the baseline (first week in February 2020).
- Monday 3 August and Sunday 9 August saw 7% and 4% increases respectively compared to the previous week, while the rest of the week showed a 1-3% increase in traffic volumes, except for Wednesday which remained the same.
- Hourly traffic volumes show interpeak levels on par with pre-lockdown levels, which may be driven by the August school holidays. Both AM and PM traffic levels have shown minor increases since the previous week, where PM peaks have returned to pre-lockdown levels and AM peaks are still significantly below.
- Analysis of vehicle classification data (where available) shows that car and HGV/LGV volumes have returned to baseline levels, while motorcycle use continues to surge well above the baseline.
Cycling
- Cycling flows for the week commencing 3rd August show a 79% increase on baseline levels, an increase of approximately 2 percentage points compared to the previous week.
- Monday 3rd August experienced a 74.5% increase on baseline cycling volumes, approximately 75 percentage points more than the previous Monday. This is most likely due to poor weather that occurred last Monday. Tuesday to Thursday this week saw an approximately 20% reduction in cycling compared to the last week, possibly due to the exceptionally warm weather on those days.
- Cycling volumes continue to increase week to week on both weekdays and weekends, however, cycling levels are significantly reduced compared to the lockdown period of May (Figure 6). This might suggest that increases in cycling reflected in June and July data reflect normal seasonality as opposed to what occurred during lockdown in April and May.
- For the week commencing 3rd August, AM and PM peak cycling volumes are showing a significant increase compared to the previous week, but are still reduced compared to weeks in April and May. This shows a shift in patterns with a sustained increase in AM and PM peak cycling compared to April and May. Although cycling between the peaks is higher than the previous week, it still remains below peak lockdown levels.
The TTF collects information from 29 data providers, geographically covering approximately 107 local authority districts for its traffic volume figures.
For cycling, it collects data from 16 providers, geographically covering approximately 84 local authority districts including nationwide canal and river paths
The TTF said it is 'looking at how these datasets can be collated in the long term as a national data asset to be used following the pandemic'.
'We hope very soon to open up the data sets so authorities can compare their own data with others and the national picture online.'
Oxford cycling data scheme
TTF also gives case studies on local projects such as Oxbike.co.uk, an experimental platform where anyone can view cycling data collected for Oxfordshire County Council and partners.
The scheme comes from the Smart Cycle Detection project, which looks to deploy new technology to better provide accurate cycling and walking data for users and insight into planning policy.
The hope is that this will show how easy it is to get around the city by cycling, how quick it can be and encourage people to travel by bike or 'Park & Pedal'.
By presenting this data, Oxfordshire County Council seeks to share and open information about cyclists in Oxford.
The report states: 'Data sources and provision of this service are experimental and noncontinuous. Due to the experimental nature of this platform and near-live data sources, Oxfordshire County Council cannot guarantee the accuracy of information provided. As new data sources and technology become available, they will be included on oxbike.co.uk wherever possible so that the public may unlock the potential of emerging smart city technology.'